This article was written by René Santing and originally published on Devhouse Spindle.
In the beginning of 2022, we cleared our schedules for an entire month to work on new challenges in product development. We tested new techniques for our future products in a month-long online event. To get started, several masterclasses were held to give more in-depth information about the techniques we were going to work with.
The first masterclass explained the differences between our telephony platform as a monolithic platform and our in-development microservices platform. This article gives you an impression of what we used to build up a microservice platform architecture.
Monolith vs microservice: how do they compare?
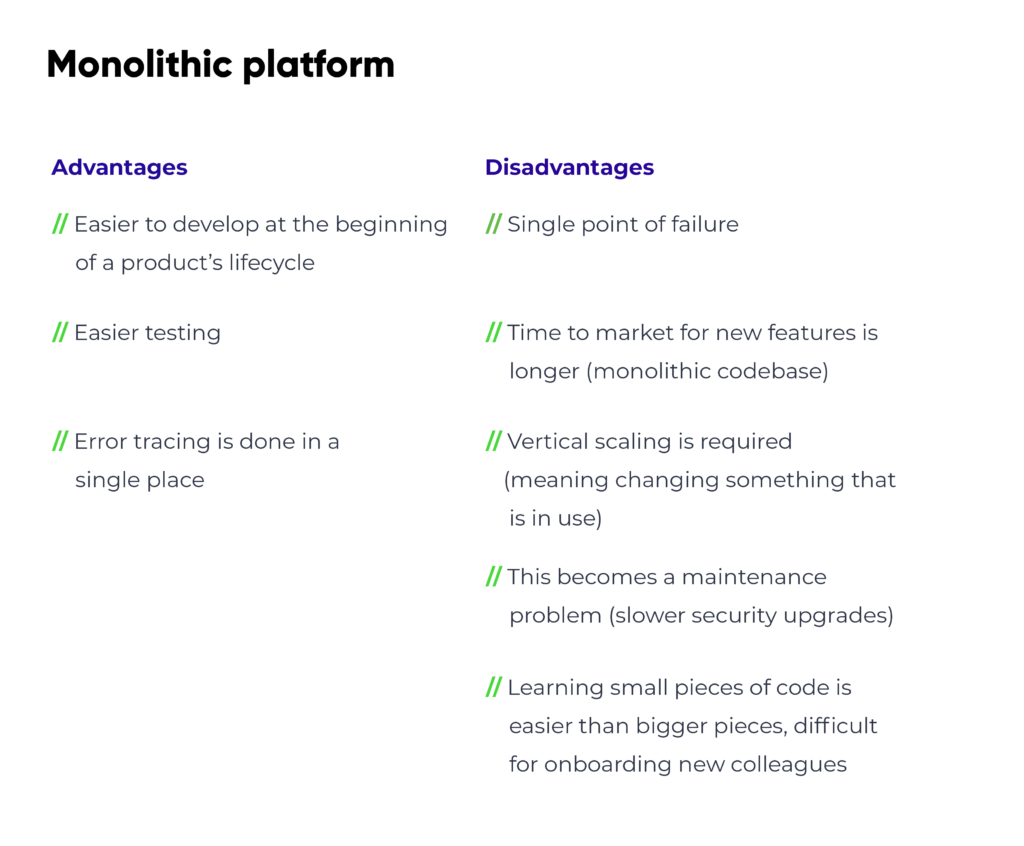
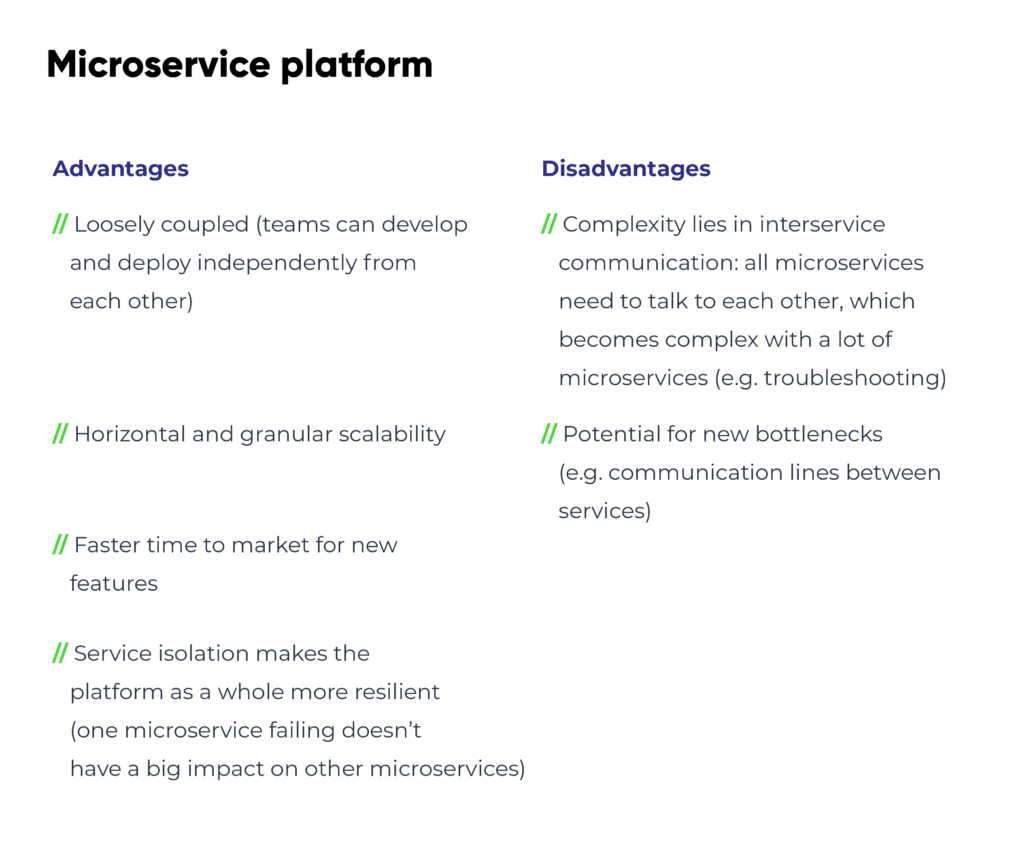
As a platform, the new microservice platform was developed to write our software and do this differently than how our old monolithic platform does it. The analogy of tiny houses versus apartments works well here, with the microservice platform representing tiny houses with their own setup for electricity and water, in comparison to an apartment building with centralized electricity and water. One equivalent in the tech stack could be that microservices have their own database, versus one single big database i a monolithic setup. These microservices talk to one another using an API that can for example give you data on who is calling who.
Below is a list of advantages and disadvantages for each platform:


Why choose a microservice platform?
So why did we want to start using a microservice platform? We believe that it will provide us with two main things:
- Be more scalable
- Speed up development
The dev event was brought to live to discern, through testing, whether we can indeed develop faster with a microservice platform.
How we arrived at a microservice platform
Throughout the past year, we went through several iterations of the microservice platform, continuing to upgrade it as we went. At the beginning, we played around with Kubernetes, combining this with projects we chose from the Cloud Native Computing Foundation (CNCF). Then we used these to make a start, alongside reviewing what other people used, and took the chance to build something.
Slowly but surely we employed more colleagues to work on the new platform. From this point onwards, we looked into an event based architecture which seems like a promising architecture for microservice platforms. We decided to try and use NATS as the central messaging bus and build the platform that way.
Event based architecture can be explained as a bus that runs between all the microservices, it passes messages on to all microservices who want to know about it.
However, we did also find out that the ecosystem around NATS and event based architecture was not really ready yet for our usecase. This would mean we would have to build more parts of the platform ourselves, leading to an increase in development time needed. In the end we decided to settle on using a service mesh and we chose Istio. There is a lot that a service mesh can do for us and also a lot that we probably don’t need. We will not go into the full details of a service mesh in this blog but there are lot of resources available online about them.
An overview of the microservice platform architecture
In short, the microservice platform architecture consists of:
- an ingress controller for which we have chosen Istio Gateway
- identity and access management (IAM) with Keycloak
- continuous integration with GitLab
- continuous delivery with Argo CD
- monitoring and logging with Prometheus, Loki, Sentry and Grafana
- distributed tracing with Kiali and Jaeger
- cloud infra through Crossplane
Below we will highlight each part of the microservice platform architecture.
1. Ingress controller
Routes to and exposes our service gateways, and performs default logic like authentication, header manipulation and rate limiting. For this, Istio Gateway was chosen because of its integration with Istio and the advanced features, which might become useful for us in the future. Istio is a service mesh that helps microservices talk to each other in a secure way.
This service mesh is a sidecar on every container, which will be injected to make sure these containers can talk to other containers (with TLS for example). With Istio we can say that we have two versions of a container, with one running a different code because we want to do A/B testing. Istio can also be described as a dedicated infrastructure layer for facilitating service-to-service communications between services or microservices, using a proxy.
2. Identity and access management
Also known as IAM, this provides developers with the ease of centralized authentication as they don’t really have to think about it. One of the main advantages of IAM is that there is one specific place in which to make everything secure.
Keycloak was chosen for the possibility to buy support for it, but also because it is open sourced and battle-tested. Alongside this, Keycloak also has flexibility, is out of the box and supports identity providers like Google. We can also run Keycloak in our own set-up, making it self hosted, which we like because then it’s closer to the rest of our platform. Lastly, we don’t have to worry about where it is hosted and it that location is secure enough in terms of privacy laws.
3. Continuous integration
We chose GitLab for our continuous integration. We already use it for Voys, for which it works well and does what we want and need it to do. The integrated features are also a bonus as they are the features we need, as well as the fact that we can use it as an SSO provider for some of the other tools, e.g. Argo CD.
4. Continuous delivery
We wanted to do continuous delivery on this new platform and the tool we chose for it is Argo CD. There are a few reasons to do continuous delivery. The main benefit of continuous delivery is that deployments become easier and therefore it’s less work to deploy small changes allowing us to go faster. Furthermore, deployment is also consistent, due to its automatic nature. This automation means no more forgetting, as well as making it easier to roll back when a mistake is made. Now someone will push it towards the staging environment, and with the click of a button, also to production.
Another useful feature is that Argo CD is declarative and can integrate with Istio to automatically do blue/green deployments using Argo Rollouts. It also has support for Helm which is a tool to manage packages for Kubernetes that we already use.
5. Monitoring and logging
When you have a service running, you also need to know what happened when something goes wrong. There are a variety of tools that we use to do this.
For metrics, we chose to use Prometheus, which we have used for years and is the de facto standard in open source software monitoring these days. We enjoy using it and it’s a powerful tool. Because of it being the de facto standard many open source tools often have Prometheus endpoints and it integrates well with Grafana to visualize metrics.
Another thing that we need is error reporting, for this we chose Sentry. We did however try to find something else, as Sentry can sometimes be hard to run self hosted, although it does have all the features we need and we have experience with it. At this time there were also no decent alternatives.
For logging, we chose Loki, which is a log aggregation system from Grafana. Using Loki we have a centralized place with all the logs from the microservices, in case something goes wrong. For Voys we use Graylog but we found out that Loki is a more lightweight and the query syntax is similar to that of Prometheus. This common syntax means that we only need to learn one, which makes trouble shooting more powerful. Loki also integrates well with Grafana to visualize metrics.
6. Distributed tracing
This part of the platform architecture gives an ID to a request, which helps us to see what happened to this ID from the beginning until the end point. This can be found out through the microservices, to understand where the request went, which microservices it hit and what happened where. Distributed tracing enables users to track a request through the mesh that is distributed across multiple services.
We store these traces in the Jaeger backend for traces which comes with their own frontend. However we also use Kiali to give developers insight in their microservices which also integrates nicely with Jaeger and can show the traces from there.
7. Cloud infra
When we make a microservice, we need an easy way for developers to deploy a database without needing our infra team. For this we chose Crossplane, which can be described as a declarative way to deploy databases and allows deployment of managed database with a custom resource definition in Kubernetes. Crossplane allows for faster development without system engineers, but it is not ideal as it is constantly under development.
Other resources for developers during the event
For the dev event, a few things were determined beforehand to ensure that development would proceed smoothly. A Python template was available to easily start out with developing a new service, and there was an API standard. Furthermore, the local development environment is based on Docker and central documentation was available in Notion, which is a tool we use as our company knowledge base.
To test out the architecture, we already built a first service before we started the dev event. This service is called Flowie and does (dial plan) routing. To help our developers at the start of the event, we also made two example services that show all the moving parts in the platform.
The second masterclass: Kubernetes platform with GitOps
In our next article about the dev event, we will dive into creating a developer-friendly Kubernetes platform with GitOps. Stay tuned!
More stories to read
On our blog we post about a lot of stuff, just go for it and read some posts for your own fun.
Go to the blog
from 16 August 2024

